Trading scans
An online brokerage was developing a mobile app for trading and wanted to integrate scans as a feature.
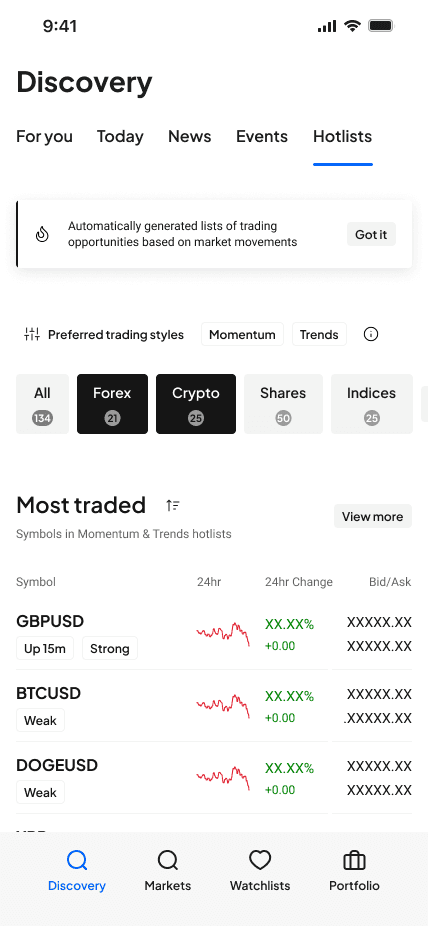
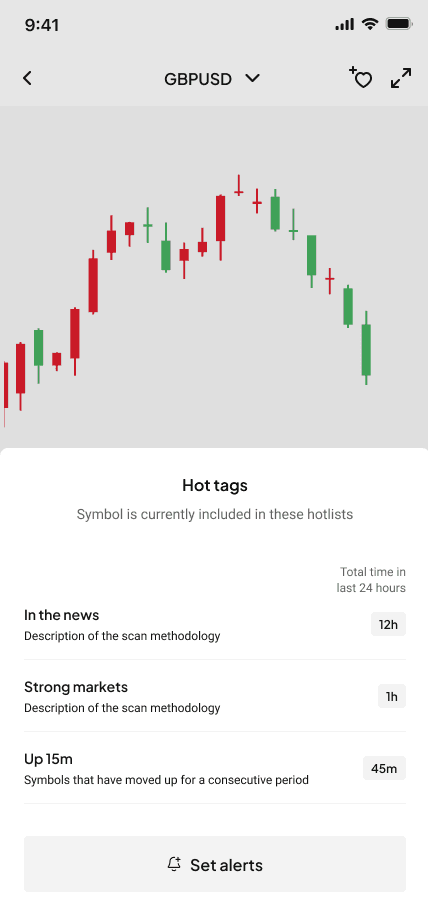
Scans are dynamically generated lists of trading instruments that meet specific criteria, reducing the need for analysis to find trading opportunities.
How could we help users to trade better through integrating scans?
Trading scans

Trading data

User journeys
Trading data
View Figma
User journeys
View Figma

Information architecture
Information architecture
View Figma

User flows

Development
User flows
View Figma
Development
View Figma

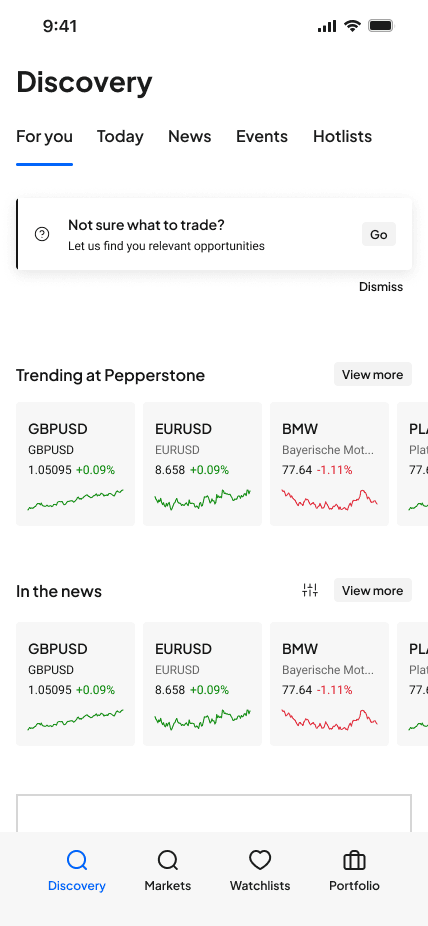
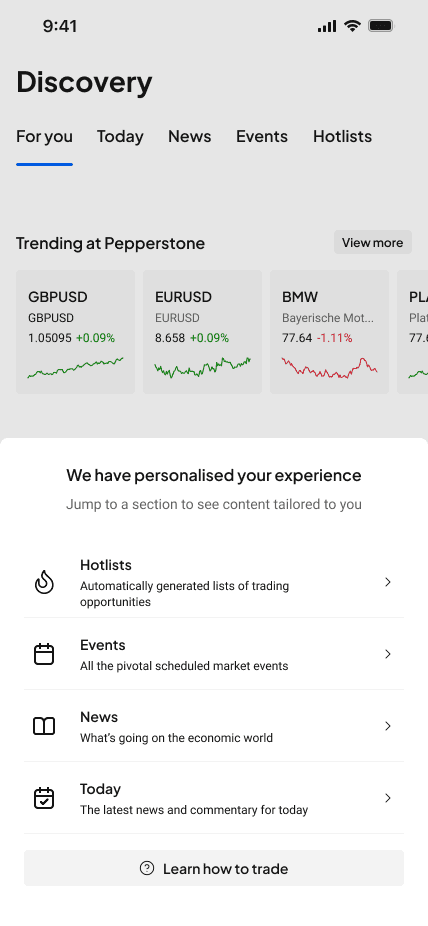
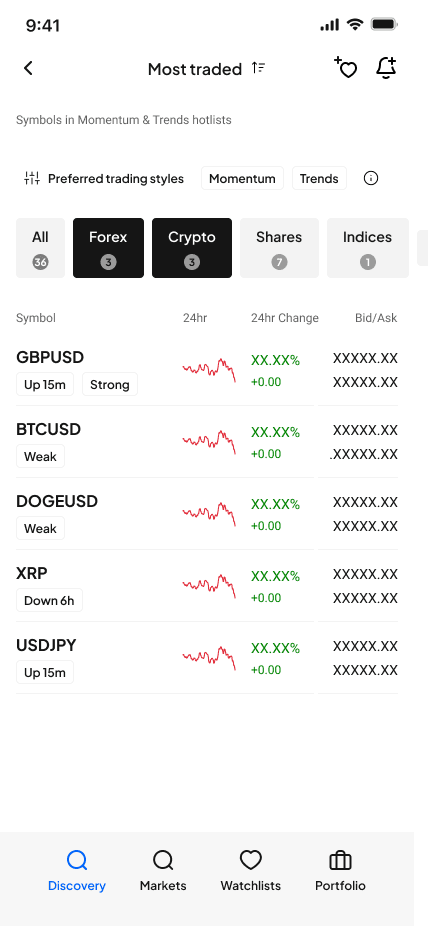
Discovery

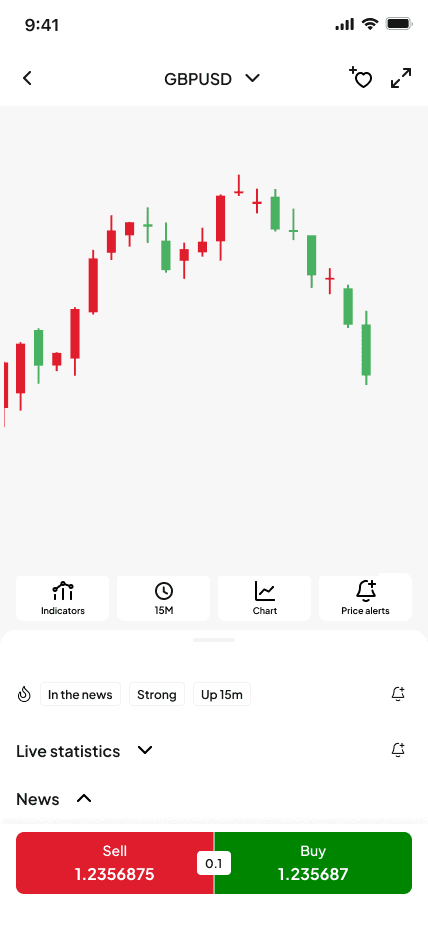
First trade

Trade execution

Second time
Discovery
View Figma
First trade
View Figma
Trade execution
View Figma
Second time
View Figma
Next Steps
Although further development was not possible within the given timeframe, the concept can be broken down into milestones which could potentially be implemented and released independently:
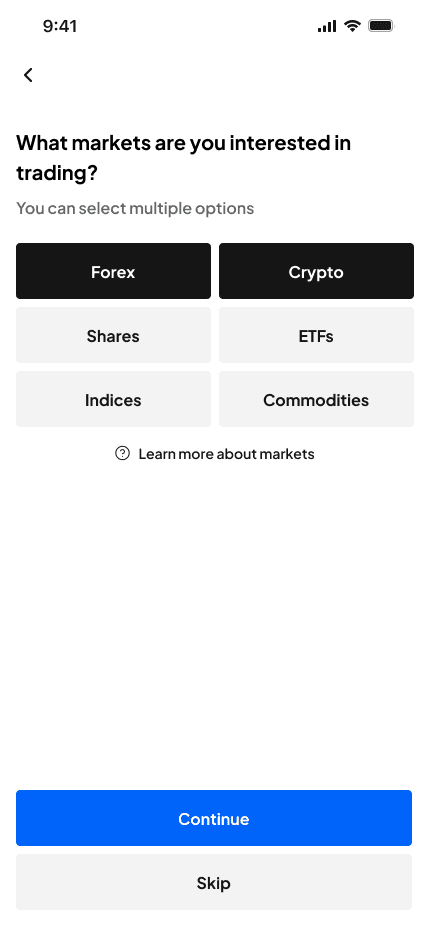
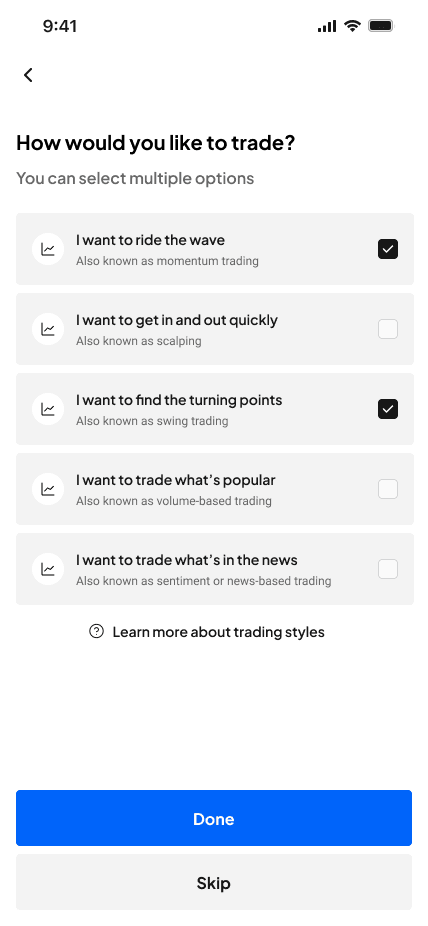
- First-time experience: Test the effectiveness of this feature for all user cohorts and assess its ability to personalise content.
- Scans: Test different user journeys to ensure understanding and decision-making.
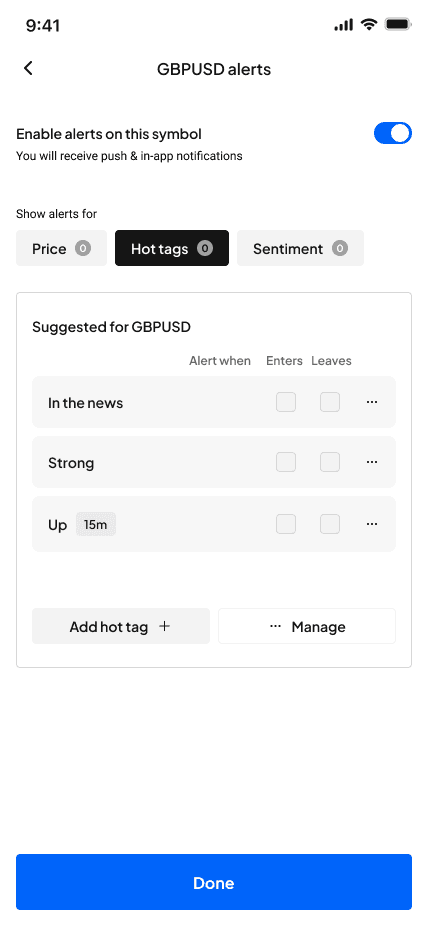
- Alerts: Assess the impact on workflow and determine additional information needed for informed decision-making.
Moderated user testing is recommended for each component to validate and refine the design with each cohort.
9 images